Did you know that there are infinite tools for extracting crude oil spot and historical prices? And you won’t have to search them because we have selected the 3 most popular API for commodity data for you! Read this entire post to know their incredible features!
The term “commodity data” refers to information on the purchasing and selling of commodities, including raw materials, local items, and materials transported to international markets. This covers the kind of commodities, price swings, their intended uses, who is buying and selling commodities, as well as any other information relating to trading commodities, particularly those factors that influence the state of the commodity market.

As one of the most significant commodities in the world, the price of crude oil can have a big impact on the economy as a whole. The price of oil is growing, and this has an impact on everything from transportation expenses to gasoline prices to producer input costs.
If you want to receive the most recent crude oil pricing, a software interface will come in handy. Real-time information transmission and reception are made feasible by an API. They are a must when creating any type of digital content format, including websites and apps.
Commodities-API
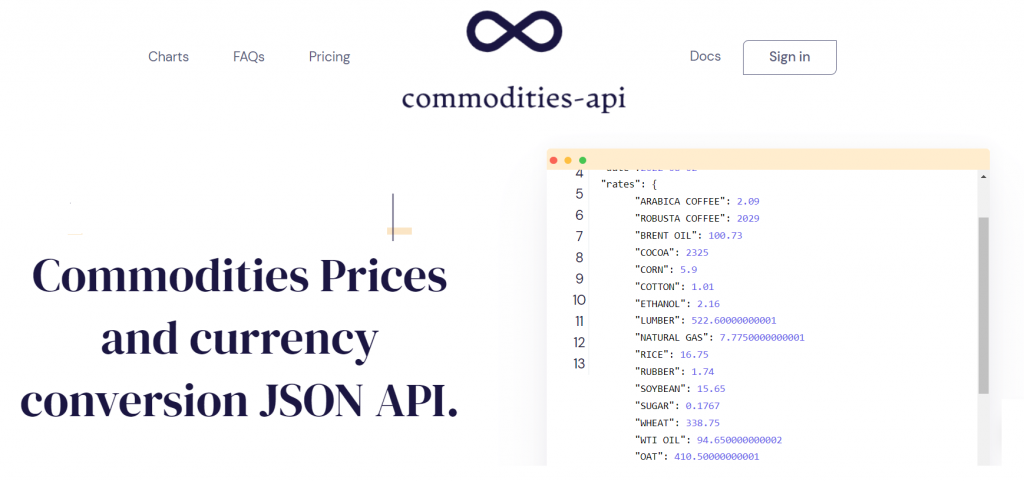
Commodities-API is used every day by thousands of developers, SMBs, and large corporations. Due to its dependable data sources and six plus years of experience Commodities-API is the greatest source for commodity pricing. It was designed primarily for developers who wanted thorough API documentation, logical code examples, and an intuitive API structure that would allow them to implement the API in under 10 minutes.

Millisecond response times, scalable quantities, and guaranteed availability are all features of the commodities-API. For live data, time-series and single currency conversion, Commodities-API provides separate endpoints.
EIA’s API
By making its open data accessible via an Application Programming Interface (API) and its open data tools, the U.S. Energy Information Administration is demonstrating its commitment to open data. The EIA’s API has many facets and includes numerous time-series data sets arranged by the major energy categories, such as the cost of crude oil, natural gas, and electricity.

For use in your spreadsheet’s graphs, tables, and charts, you can directly download EIA energy data as well as economic data from the St. Louis Federal Reserve (FRED). As soon as the data is changed, your charts and tables will update immediately.
Get more data about it here https://www.eia.gov/opendata/
Quandl
Quandl is an open source financial platform that provides access to financial and economic data from over 500 sources. It offers an API that allows users to programmatically access the data and query it for various analytics and visualization purposes, such as stock market research, economic indicators, financial analysis, and more. It will let you know the prices of a lot of commodities.

The API supports both REST and streaming access to the data, and uses a simple, easy to understand syntax for queries. Quandl also provides a variety of tools and resources to help users get the most out of the data, such as tutorials, data libraries, and custom reports.
You can start using in its website https://data.nasdaq.com/publishers/QDL

